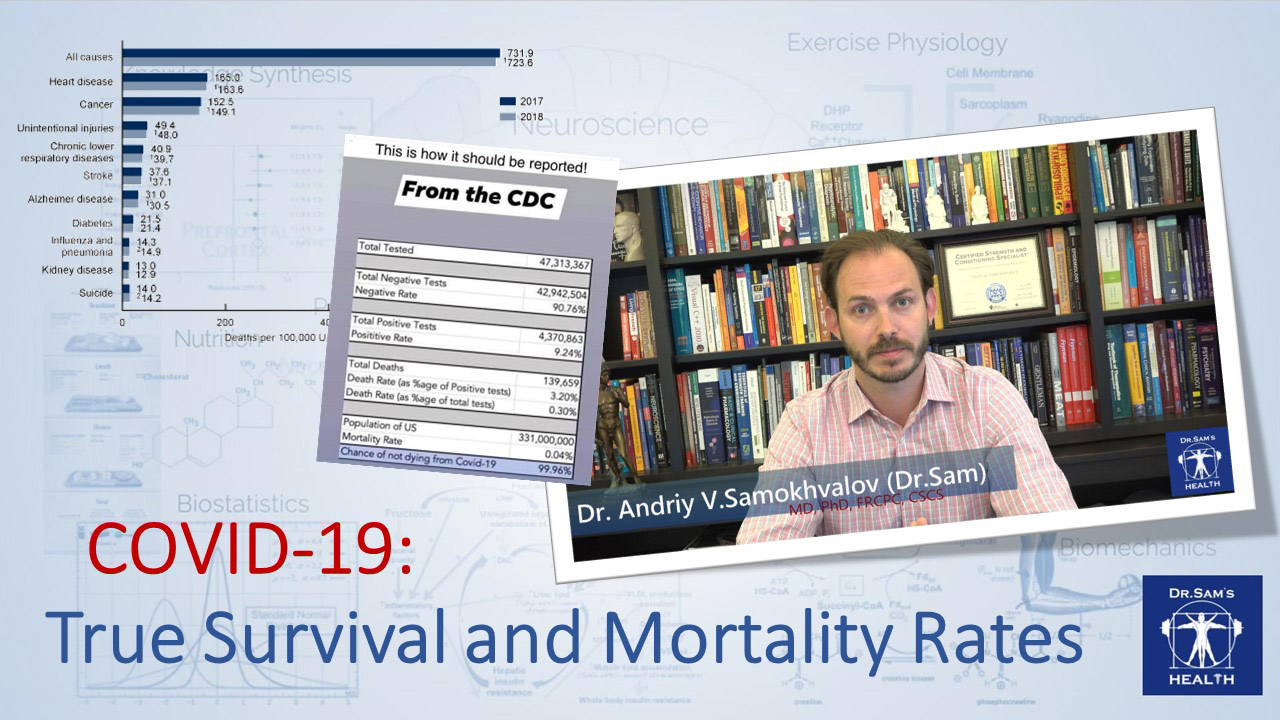
The virus has been there for a while already – we're in August 2020. It looks like the curve has been more or less flattened and the economy is reopening. We're in the phase 3 in Ontario and people are discussing lots of things. In particular, they are looking back at the most difficult moments and judge the decisions made in the past. I've been receiving lots of messages with a new meme – "We have ruined economy for a virus with a 99.96% survival rate! This is how it should be reported!"
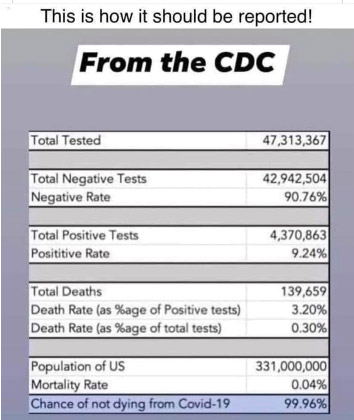
And as a scientist who knows statistics and epidemiology, I must say that this is a clear misrepresentation of the actual data and I think that this kind of post/meme indicates the need for a proper explanation and an educational opportunity for me – I can actually show how it should be reported.
The virus doesn't have the 99.96% "survival rate"! Let me explain and let's start with mortality and fatality rates.
1.Mortality rates
We have several indicators that describe mortality depending on the research question we ask ourselves. First of all, we have a series of different mortality indicators that describe mortality in general population – how many people died during certain period of time. Usually these numbers are reported as per 100,000 or per 1,000 people depending on how big the number of deaths is.
First of all, we have crude mortality rate – number of deaths per 100,000 people during certain period, usually a year. From all causes, without any adjustments. Speaking of adjustments – often we need to standardize mortality rates by taking into account the age and sex distribution of a specific population (or other factors). When we are talking about US, the typical all-cause mortality rate is around 700-850/100,000 or 7-8.5/1,000 or 0.7-0.8% (I am taking these statistics from Wikipedia, so that anyone interested could check them). That's a good number to keep in mind for future comparisons.
Then we have cause-specific mortality rate – the number of deaths per 100,000 people during certain period of time, from a specific cause. That is something we are particularly interested in in case of COVID-19. So, let's assume that the statistic quoted in the post is correct – we have 139,659 deaths from COVID-19 with the population of 331 million people. The problems start with people dividing these two numbers and coming up with the "mortality rate". Yes, it is a mortality rate, but they do not specify the time period – usually it is calculated for either an outbreak or per year. So, I checked the number of COVID-19 deaths at Johns Hopkins University (they have a great interactive map) – we have 169,640 deaths in the US reported as of August 16, 2020. As far as I remember, the first case was registered on January 20, 2020. Using these parameters, we can extrapolate these data to a full year (as cringeworthy as it would be for a true epidemiologist) and get almost 300,000 COVID-19 deaths per year or 0.09% mortality rate. I know that this statistic will be immediately compared to a regular flu, so let me explain what is wrong with it.
2. What is wrong with using mortality rate for COVID-19
The main issue with this statistic is that we are trying to estimate the mortality rate from a virus that first appeared in the US on January 20, 2020 and has been exponentially spreading all over the country. The initial numbers were very low, then they grew very fast, then there were steps taken to curb the spread of the virus and to flatten the curve and all that taken together resulted in much lower mortality rate than expected during the first 7 months or so of the pandemic in the US. And it's hard to extrapolate as the virus is supposed to spread exponentially. And that is the reason why we use different indicators to understand infectious disease outbreaks – case fatality rate and infection fatality rate. I'll get to them in a second, but I would still like to compare the cause-specific mortality rate of COVID-19 to other conditions.
3. Comparing cause-specific mortality rates
I know that the 0.09% is not going to shock or impress anyone, but I would really like to put things in prospective. According to my primitive extrapolation the annual mortality rate for COVID-19 would be 89.5 deaths per 100,000 people, which is a standard way of reporting these numbers. Let's compare it to other causes, the top-10 in the US, according to CDC:
The data for 2018 indicates that there were 723.6 deaths / 100,000 from all causes in the US, which already puts COVID-19 as a major contributor to the death toll as it would take up to 12.4% of all deaths in the US.
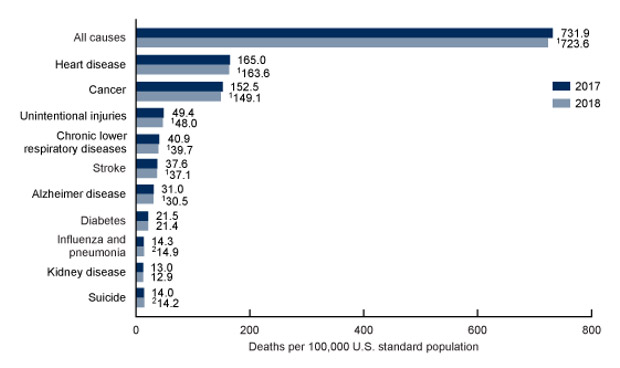
And even with the minimal numbers that we have now, COVID-19 would become the 3rd leading cause of death in the United States, surpassed by only two categories - heart disease and cancer. Seriously, we have enough reasons to worry already at this point.
And to compare it to influenza and pneumonia deaths, using the same source of information, COVID-19 would take 6 times more lives than influenza!
4. Fatality Rates
Ok, now let's move on to the proper indicators of mortality – Case Fatality Rate and Infection Fatality Rate. The cause-specific mortality rates are not appropriate in case of an actively spreading virus as the grow exponentially and depend on virus spread as well as the countermeasures we take to prevent it. That is why we need to use some sort of indicators that have the number of cases in the denominator, not the population as a whole.
Case Fatality Rate (CFR) is the number of deaths among confirmed clinical cases and the Infection Fatality Rate (IFR) is the number of deaths among infected individuals. Given the confusion with the clinical diagnosis of COVID-19 due to a large number of asymptomatic carriers, it's safer to use IFR, which is reported in the "meme" post as "Death Rate" of 3.2%. I won't dispute this number as it's close to the most up-to-date statistic (which is 3.16% as of August 16, 2020 if we use the Johns Hopkins Interactive Map data).
They also report a 0.3% "Death Rate" among people tested for the virus, but it doesn't really make much sense to use it, again, as the virus spreads and this number will change with time. As a matter of fact, if we assume that at certain point everyone will get the virus, the 3.2% IFR means that there will be over 10 million deaths in the United States, which is the main reason everyone is so concerned about it. The cause-specific mortality rate appears to be low because people do not compare the COVID-19 mortality to other causes of death and do not take into consideration any major factors that determine it.
5. The "Survival" Rate
Ok, let's tackle the last item on my list – the "survival" rate. To put it very simply, in order to survive something, you must have it in the first place and calculating the survival rate based on total population is ridiculously wrong! Using the data we have now, we could say that it's 96.84% now, but not 99.96% quoted in the "meme" and even though the correct number still seems to be very high, it still means over 10 million deaths if everyone gets infected.
Summary
There is a lot of misinformation out there and the CDC data "meme" is very misleading. The COVID-19 death toll is much higher than the regular flu. As a matter of fact, it would be the third leading cause of death in the US according to my most conservative estimates. And based on the current infection fatality rate it will result in over 10 million deaths if nothing is done to prevent its spread. I hope that you can see my logic and the information I share was convincing enough, but I don't expect everyone to believe my arguments and estimates. You can always think things through on your own, hence the references below.
As always, I would like to remind you that this blog should not be taken as medical advice and that my opinions do not necessarily represent the official standing of regulatory and public health authorities I belong to. At the same time, I believe that my points are valid, and I would like to encourage you to subscribe to this website, and to my YouTube channel. You are also always welcome to communicate with me via making comments, suggestions, and asking questions, either here, or on social media platforms.
Stay safe, strong, and healthy!
Dr.Sam
References:
1. Johns Hopkins Interactive Map
2. CDC Cause-Specific Mortality Rate Data for 2017/2018